 Ortho/Residency
  OMPT Fellowship
  Hand Fellowship
 Prevalence of Diagnoses in the Lumbar Spine
The Numbers
So here’s the thing. I don’t know about you, but I feel like I hear people come into the clinic almost every day and tell me that their arthritis was the worst the doctor has ever seen on an Xray, CT, or MRI. Or that they have this thing called degenerative disc disease and it’s really bad. And now they have this label slapped on their pain and that is exactly what it is. No discussion. Because that MUST be the cause of their pain, right?
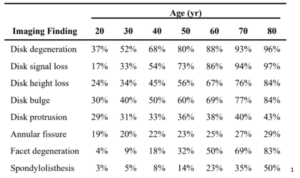
Well, let’s dive into some research. Put on your scuba gear because we’re going to be looking at a lot of charts. First, a systematic review published in 20151 found that estimated prevalence based on their research looked something like this.
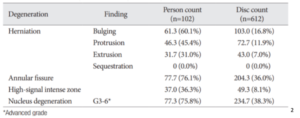
And a study done in Korea in 20132 did not divide the information by age (average age was 46.3±17.8 ranging from 14 to 82), but their results were in the next beautiful chart.
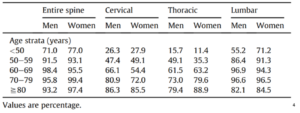
Based on this it looks like our patient’s back pain could definitely be coming from disc degeneration. But here’s the thing. These were based on imaging completed on asymptomatic individuals. People who have zero pain and symptoms. People walking down the street who have never in their lives had low back pain that participated in the study. We also know that degree of degeneration is also not a good predictor of pain intensity or if there will be a neuropathic component.3 Another study completed in Japan delved into prevalence in their population-based study.4 The difference in this study was that it encompassed both symptomatic and asymptomatic individuals. Participants who said they had low back pain included 43% of the participants. When you compare the ranges with those in the 2015 study that differentiates ages, it’s not too different.
And an exciting thing? Yet another study found that over a 5 year timespan, only 16% showed of individuals showed any change or regression on a repeated MRI.5 Overall it seems like the main factor is age and possibly gender as well. Even in individuals who have been active, we tend to see a similar progression of degenerative changes across the lifespan.6
Here’s my question though. If we know how prevalent these diagnoses are in the lumbar spine in asymptomatic individuals, why are we still acting like their disc bulge is the sole contributor to their pain? And why are we ordering so many MRI’s just to be told something that was expected? I must say that I have seen progress in the last five years in regards to not immediately ordering an MRI when someone complains of low back pain. 5 years ago on my first clinical rotation I would have patients come in and tell me they’re only coming in for 4-6 visit because then they can get an MRI. Now it’s closer to 4-6 weeks. Which gives us as therapists a much better opportunity to impact their lives. But why do we see MRI’s ordered so frequently? And Xrays? It seems like you walk in the door to a doctors office with a musculoskeletal complaint and you’re immediately sent to get an Xray. Do not pass go, do not collect $200.
The Why
Let us state the obvious first. Imaging is excellent at catching more sinister pathologies and gives us an otherwise unavailable view at what is going on in an area. It’s the closest we can get to actually seeing the structures. It is incredibly helpful in catching more severe diagnoses that PT is unable to treat and can truly be a lifesaver. Imaging is very important, especially with red flag concerns, but my question is more about the application.
An interesting article took a look into overtreatment in the United States. 2106 physicians from the American Medical Association participated in a survey on the topic. While this is not solely about imaging, I will direct it that way a bit. Of the participating physicians, the percentage of care delivered that is unnecessary for tests was 24.9%. 37.7% believed that at least 30-45% of tests are unnecessary. And the top five reasons for overtreatment? Fear of malpractice, patient pressure/request, difficulty accessing prior medical records, borderline indications, and inadequate time to spend with patients. They also discussed solutions to overtreatment with 66% responding that de-emphasizing fee-for-service bonus pay would help reduce utilization.9
The Cost
One of the biggest things in our healthcare system is money. Everything seems to be expensive (to me at least). I did a clinical rotation in Italy and it was like night and day. If you had a valid medical reason, you could stay at the inpatient rehab facility (which was very different from our inpatient rehab patient demographics) for 30-60 days with a bed, meals, and therapy with no cost because you paid taxes. On the flipside of that, access was not as easy. There are many pros and cons, but I won’t get into that here.
In 2016 the US spent 17.8% of its GDP on medical spending whereas other countries spent between 9.6-12.4%. With that, utilization was similar to other countries, except in imaging. The US fell second in that area following Japan with 118 MRI exams per 1000 individuals in the population and 245 CTs per 1000 individuals. The average for other countries was 82 MRIs and 151 CTs.10 Another count had us at number four in 2017 behind Germany, France, and Japan with 110.8 MRI exams performed per 1000 individuals in the population.11 We also have the highest number of MRI units (as of 2017) with 37.56 units per million in our population. The runner up there is Germany at 34.49 units, then Korea at 29.08 units.12
With prices of MRI units alone ranging from a couple hundred thousand dollars to several million12, 13 and a high quality used CT scanner sitting at two hundred thousand dollars13 we’re starting off strong on the medical spending. Then, when a patient is referred for imaging, it can cost them between one and four thousand dollars for an MRI12, 13, 14 and between six hundred and two thousand for a CT scan.13 Which means that someone may be spending three thousand dollars (minus what insurance covers) to be told that they have a diagnosis that over 90% of people in their age range have. That’s a lot of money to be told that you’ve aged.
The Breakdown
Now, obviously I am a bit biased. I’m a doctor of physical therapy. I tend to follow the conservative route versus telling people to get imaging and have surgery, then come see me at the end anyways. I’ve been trained to look for red flags that may signal something more sinister like cancer, cauda equina syndrome, etc. And I have definitely had patients that have not progressed as expected and I’ve sent them back to their doctor for imaging. Or patients who I sent back to their doctor right away because they had some red flags that set off my radar. But with all of this we must bring it around to the patient. Because that’s what it’s all about. So we already know they are going to be spending a lot of money for imaging (unless their insurance covers it). That’s a given. A lot of people avoid imaging for that reason. But what else?
My biggest concern with application to patients dives into pain science. Remember in PT school when you were learning a bunch of diagnoses and all you could think was “I definitely have mad cow disease. I lived nowhere near where it was, but I definitely have all the symptoms.” When all of a sudden you had the most obscure diseases or diagnoses? Well this is something that comes back around to pain science. If someone tells you that you have the worst arthritis they have ever seen and they don’t know how you even walk around, guess what? It may start to get harder to walk around. Because our brains our powerful. And someone you trust just told you that it should hurt more. So it starts to hurt more.
What does that mean we’re doing to our patients cognitively? When we say something like that to them, what does it do? When they have imaging done that tells your 80 year old patient that she has disc degeneration, then sends her out the door with a script for PT, what kind of confidence does that patient have? When in reality, over 96 percent of individuals over the age of 80 have disc degeneration in an asymptomatic population.1 Maybe a little (or a lot) of education is in order. We may be breaking down walls that this person has had up for decades while dealing with low back pain. We’ll be dipping in to that PNE knowledge. And empowering our patients.
Because first and foremost, that’s what we do. We give our patients the knowledge and the tools to succeed. We make sure they are safe (shout out to that doctorate), but we recognize that most results on an MRI, CT, or Xray aren’t all that big and bad. We give the patients the tools to feel strong and encourage them to grow and trust their body because it is strong, it is resilient, and what they are going through is not abnormal. They will succeed. They will get back to playing with their grandchildren. They will be able to carry the laundry basket up stairs again and stop having their spouse help (if they really want to).
1 Brinjikji W, Luetmer P, Comstock B, et al. Systematic Literature Review of Imaging Features of Spinal Degeneration in Asymptomatic Populations. American Journal of Neuroradiology. 2014;36(4):811-816. doi:10.3174/ajnr.a4173.
2 Kim SJ, Lee TH, Lim SM. Prevalence of disc degeneration in asymptomatic Korean subjects. Part 1: Lumbar spine. J Korean Neurosurg. 2013;53:31-38.
3 Vagaska E, Litavcova A, Srotova I, et al. Do lumbar magnetic resonance imaging changes predict neuropathic pain in patients with chronic non-specific low back pain? Medicine. 2019;98(17):1-9
4 Teraguchi M, Yoshimura N, Hashizume H et al. Prevalence and distribution of intervertebral disc degeneration over the entire spine in a population-based cohort: the Wakayama spine study. Osteoarthritis and Cartilage. 2014;22:104-110.
5 Carragee E, Alamin T, Cheng I, Franklin T, Van den Haak E, Hurwitz E. Are first-time episodes of serious LBP associated with new MRI findings? Spine J. 2006;6(6):624-35.
6 Healy JF, Healy BB, Wong WH, Olson EM. Cervical and lumbar MRI in asymptomatic older male lifelong athletes: Frequency of degenerative findings. J Comput Assist Tomogr. 1996;20(1):107-12.
7 Kjaer P, Leboeuf-Yde C, Korsholm L, Solgaard Sorenson J, Bendix T. Magnetic resonance imaging and low back pain in adults: A diagnostic imaging study of 40-year-old men and women. Spine. 2005;30(10):1173-80.
9 Lyu H, Xu T, Brotman D, et al. Overtreatment in the United States. PLoS ONE. 2017;12)9)”e0181970.
10 Rohman, M. JAMA: U.S. spends the most on healthcare-and imaging is a reason why. HealthImaging. March 14, 2018. July 5, 2020. https://www.healthimaging.com/topics/practice-management/jama-us-spends-most-healthcare-and-imaging-reason-why
11 Magnetic resonance imaging (MRI) exams per 1,000 population, 2017. The Commonwealth Fund. July 5, 2020. https://www.commonwealthfund.org/international-health-policy-center/system-stats/mri-exams?redirect_source=/stats/mri_exams
12 Mikulic M. Number of magnetic resonance imaging (MRI) units in selected countries as of 2017. Statista. August 9, 2019. July 5, 2020. https://www.statista.com/statistics/282401/density-of-magnetic-resonance-imaging-units-by-country/
13 Malone P. Doctors ordering wasteful and excessive MRI and CT scans, experts say. DC Medical Malpractice & Patient Safety Blog. January 31, 2019. July 5, 2020. https://www.protectpatientsblog.com/doctors-ordering-wasteful-and-excessive-mri-and-ct-scans-experts-say/
14 How much does an MRI cost? July 5, 2020. https://www.honorhealth.com/patients-visitors/average-pricing/mri-costs
Recommended courses:
Comprehensive Management of the Lumbopelvic Region